PGA Tour Benchmark vs Amateur Benchmark: Which Should You Use?
Most strokes gained tools only compare you to the PGA Tour. That number is honest but rarely useful. Here is when to use it, when to use an amateur baseline, and why a single app should give you both.
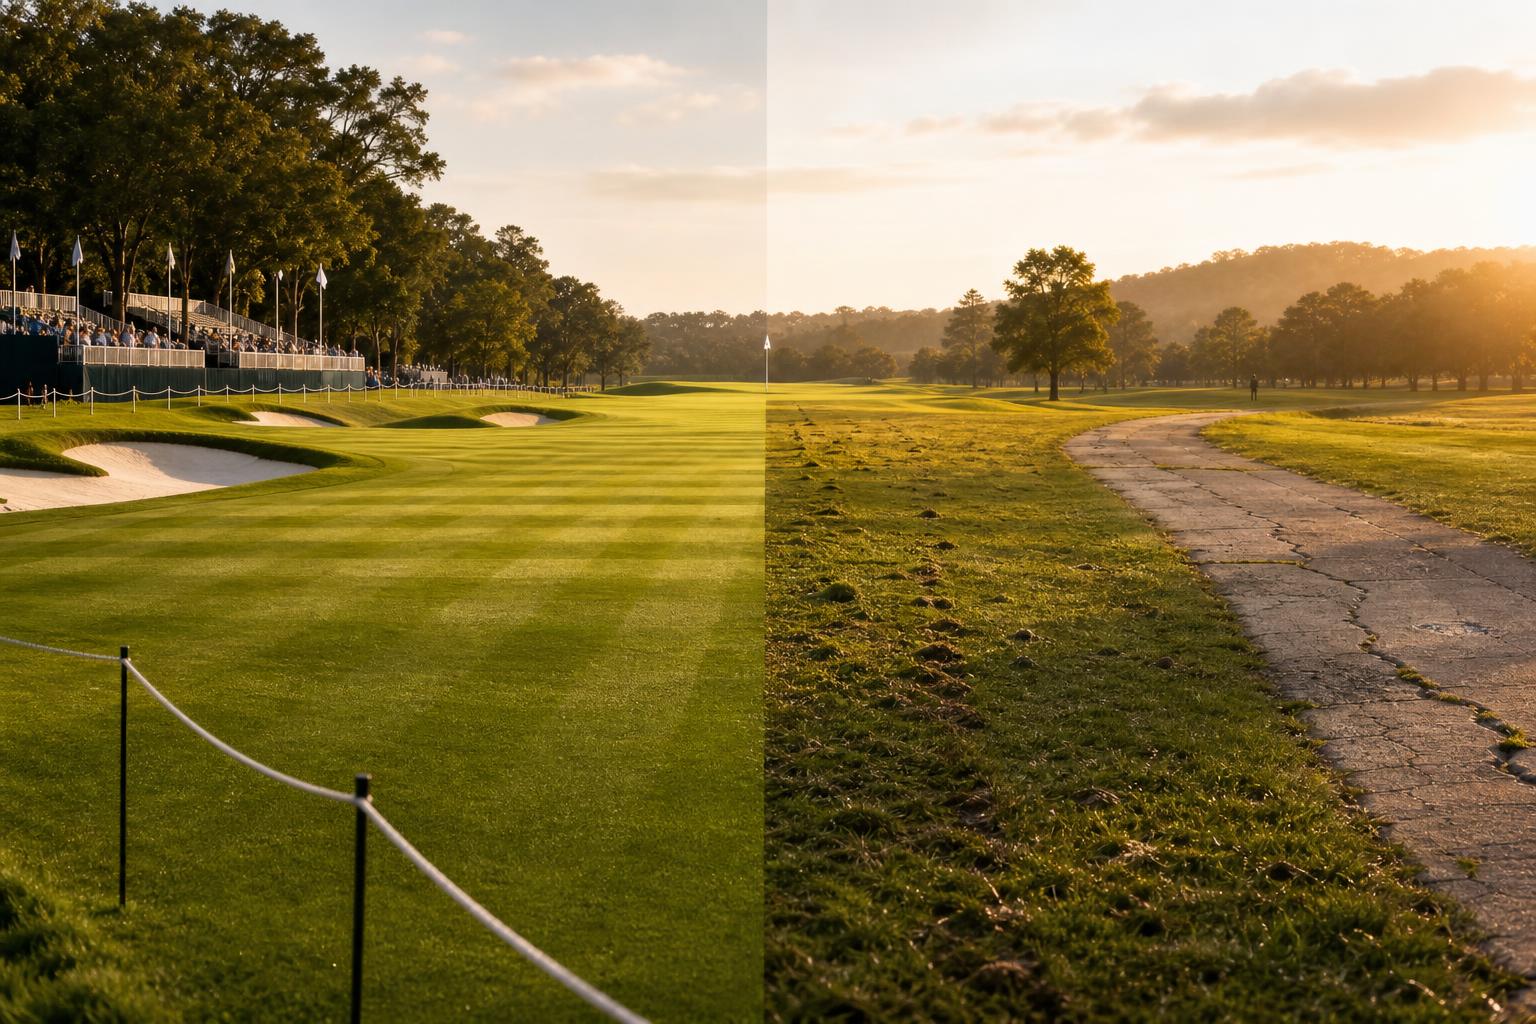
If you have spent any time looking at strokes gained, you have probably noticed that almost every public tool — Mark Broadie’s original ShotLink work, the figures you see on tour broadcasts, the calculators floating around the internet — uses the PGA Tour as the baseline. A strokes gained value of 0.0 means you played like the average tour pro from that situation. Anything negative means you fell short.
That is mathematically clean and historically meaningful. It is also, for the vast majority of golfers, kind of useless on its own.
A 15-handicap who shoots 88 already knows they are not on tour. Telling them they were -12.5 strokes against the PGA Tour last Saturday does not help them practice on Sunday. What they actually want to know is: was I better or worse than other 15-handicaps today?
This post lays out the difference between the PGA Tour benchmark and an amateur benchmark, when each one is the right lens, and how to use both side by side. It is also where golfity diverges from most strokes gained tools: instead of forcing you to pick one baseline, the app lets you compare your shots and rounds against pro, scratch, 5, 10, 15, 20, and 25-handicap baselines and switch between them at any time.
The Two Benchmarks, Defined
A strokes gained baseline is the expected number of strokes it takes a reference player to hole out from a given lie and distance. Mark Broadie’s original work, summarized in the creator of strokes gained profile, built the first reference table from PGA Tour ShotLink data — millions of shots from the best players in the world. That table is the source of the values you see on broadcast graphics.
A strokes gained number is the difference between your shot and the baseline:
SG = (Baseline strokes from start) - (Baseline strokes from finish) - 1
Change the baseline and the number changes. Same shot, same outcome — different reference.
- PGA Tour benchmark: how the average tour pro plays from that exact situation. The hardest baseline to beat.
- Amateur benchmark: how a reference amateur (scratch, 10-handicap, 20-handicap, etc.) plays from that same situation. Calibrated to the level you are actually trying to compete with.
Both are correct. Both are useful. They answer different questions.
What the PGA Tour Benchmark Actually Tells You
The tour baseline is the original strokes gained scale and it has real value, even for an 18-handicap.
It is the only baseline that doesn’t drift. PGA Tour pros are the closest thing golf has to a fixed reference point. The expected strokes from 150 yards in the fairway has barely moved across decades of ShotLink data. Amateur baselines are messier — they depend on which amateur dataset you trust and how it was sampled.
It puts your improvement on an absolute scale. If you tracked yourself at -14.0 against the tour two years ago and you are at -10.5 now, that is real, measurable, decade-comparable progress. You shaved 3.5 strokes off the only baseline that never changes.
It tells you the size of the entire mountain. A scratch player loses about 3 strokes a round to the tour. A 10-handicap loses about 9. A 20-handicap loses about 15. Those numbers tell a true and somewhat humbling story about how wide the gap really is between weekend golf and tour golf.
The trouble is that the tour baseline is the only baseline most apps offer. And as a daily practice signal, it can be misleading.
Why the PGA Tour Baseline Misleads Amateurs
If you are a 15-handicap, almost every shot you hit is “below tour average,” because tour average is a 60th-percentile shot from a 70th-percentile player. The tour baseline is calibrated for a population you are not in.
That creates three specific problems.
1. Every Category Looks Like a Disaster
Tracked against the tour, a 15-handicap typically sees something like:
| Category | SG vs PGA Tour |
|---|---|
| Off the Tee | -2.7 |
| Approach | -6.0 |
| Around the Green | -2.0 |
| Putting | -1.5 |
| Total | -12.2 |
Every line is negative. Every category looks broken. There is no signal about which category is your relative strength because the baseline is so far above you that the entire game looks like one big leak. Approach is genuinely the biggest leak (we cover this in the complete guide to strokes gained categories), but the tour baseline drowns out the smaller, equally important question of where you — at your level — gain and lose strokes.
2. Improvement Looks Tiny
Move your approach from -6.0 to -5.0 over a winter of work and that is a real, hard-won 1-stroke gain. But on the tour scale, you went from “very far below tour” to “still very far below tour.” It does not feel like progress. It can be hard to stay motivated when the baseline is set so far away that any gain still leaves you in deeply negative territory.
3. It Doesn’t Match the Players You Actually Compete With
Most golfers play against people in their handicap range — club mates, league partners, friends, members of the same Saturday foursome. The interesting comparison is not “how far am I from Scottie Scheffler” but “how do I rank among 15-handicaps?” The tour benchmark cannot answer that.
This is the hole the amateur benchmark fills.
What an Amateur Benchmark Tells You
An amateur benchmark calibrates the 0.0 baseline to a specific handicap level. A scratch baseline says “0.0 means you played the shot exactly like an average scratch golfer.” A 10-handicap baseline says “0.0 means you played the shot exactly like an average 10-handicap.”
Same shot, very different number.
Here is a worked example. You hit a 7-iron from 165 yards in the fairway and the ball ends up 28 feet from the hole. You then two-putt for par.
| Reference Player | Expected from 165 yds | Expected from 28 ft | SG on the iron |
|---|---|---|---|
| PGA Tour avg | 2.92 | 1.89 | +0.03 |
| Scratch amateur | 3.05 | 1.95 | +0.10 |
| 10-handicap | 3.30 | 2.05 | +0.25 |
| 15-handicap | 3.46 | 2.10 | +0.36 |
| 20-handicap | 3.60 | 2.18 | +0.42 |
The shot itself didn’t change. But against a 15-handicap baseline it was a clearly above-average iron shot (+0.36). Against the tour, it was forgettable (+0.03). For a 15-handicap golfer trying to figure out which of their iron shots actually beat their level, the 15-handicap baseline is the more useful number.
If you walked off the course thinking “I struck the irons well today,” the amateur benchmark is what would confirm or refute that gut read. The tour baseline mostly cannot.
This is the same dynamic that makes strokes gained the only stat that matters — but it only matters as a signal if the baseline is set somewhere you can actually get above on a good day.
When to Use Each Baseline
A simple framework: pick the baseline that matches the question you are trying to answer.
| Your Question | Use This Baseline |
|---|---|
| How big is my entire gap to elite golf? | PGA Tour |
| Am I trending toward a long-term goal of scratch / single digits? | PGA Tour |
| Did I play above or below my level today? | Your handicap level |
| Which category is my real strength compared to peers? | Your handicap level |
| Is my approach holding me back relative to other 15-handicaps? | 15-handicap |
| What does the next handicap bracket look like? | One bracket better |
| Comparing two amateurs of similar level head-to-head | The shared bracket |
| Bragging rights about that one perfect 8-iron | PGA Tour, obviously |
A practical pattern that works for most amateurs: use your own handicap level for round-to-round practice signal, and use the PGA Tour baseline for season-over-season progress. Different timescales, different baselines, no conflict.
The Five Levels golfity Lets You Switch Between
Most strokes gained tools force a single baseline. golfity ships with seven, and you can switch between them at any time inside the app:
- PGA Tour — the original baseline. Honest, fixed, hard.
- Scratch (0) — the upper edge of amateur golf. Roughly the level a club champion plays.
- 5 handicap — the strong amateur. Single-digit territory.
- 10 handicap — the most common “improving” handicap range.
- 15 handicap — close to the global average for tracked golfers.
- 20 handicap — a typical “casual but committed” weekend player.
- 25 handicap — the level where short-game volatility dominates the scorecard.
Each one is a fully calibrated baseline table. Distance and lie expectations get re-derived for the chosen player level — not just shifted by a constant. That matters because the gap between a tour pro and a 25-handicap is much bigger from 200 yards than it is from 5 feet. A flat offset would lie about where the leaks actually are.
In practice, a 12-handicap will typically:
- Set their default baseline to 10 or 15 handicap to read their daily rounds.
- Flip to scratch to see what the next aspirational level looks like — which categories would need to move and by how much.
- Flip to PGA Tour once a quarter to track long-arc progress.
You can run the same shot through every baseline in the strokes gained calculator and the strokes gained putting calculator to see how the number shifts. Same input, seven different reference players, seven different SG values.
A Concrete Example: Two Players, Two Stories
Let’s compare two real golfers who both shoot 88 on the same course.
Player A is a 15-handicap whose round looked like this against the PGA Tour:
| Category | SG vs PGA Tour |
|---|---|
| Off the Tee | -2.0 |
| Approach | -7.5 |
| Around the Green | -1.5 |
| Putting | -1.0 |
| Total | -12.0 |
Player B is also a 15-handicap, also shot 88, with this profile:
| Category | SG vs PGA Tour |
|---|---|
| Off the Tee | -3.5 |
| Approach | -5.0 |
| Around the Green | -1.5 |
| Putting | -2.0 |
| Total | -12.0 |
Against the tour, the two rounds look similar. Both -12.0, both 88s, both a wash.
Now switch to the 15-handicap baseline:
| Category | Player A | Player B |
|---|---|---|
| Off the Tee | +0.7 | -0.8 |
| Approach | -1.5 | +1.0 |
| Around the Green | +0.5 | +0.5 |
| Putting | +0.5 | -0.5 |
| Total | +0.2 | +0.2 |
Both played slightly above their level (the 88 was actually a very mild outperformance compared to a typical 15-handicap round). But now the categories tell completely different stories.
- Player A drove it well for a 15, putted well for a 15, and under-performed their level on irons. Their practice plan is obvious — get the irons to neutral against the 15-handicap baseline first, then push toward the 10-handicap baseline.
- Player B has a different game entirely. Strong irons for a 15, average short game, and the round leaked through driver and putter. Same handicap, same score, opposite practice list.
The tour baseline alone could not surface that difference. The amateur baseline can. This is the same idea we develop in how to read your strokes gained numbers and how to practice based on your strokes gained data.
When the Amateur Benchmark Can Mislead
It would be tempting to drop the tour benchmark entirely. Don’t.
Sample size warning. Public amateur datasets are smaller than ShotLink. The 5-handicap baseline at 175 yards from the rough is built from a much smaller sample than the equivalent tour figure. The numbers are reliable in aggregate but a little noisier on rare lie/distance combinations. Treat the amateur baseline as an excellent practice signal, not a perfect reference.
Beware of comfort. A 20-handicap who only ever views their game against the 20-handicap baseline can talk themselves into thinking they have arrived. The honest read of “you are -2.7 strokes off the tee against PGA Tour pros” is uncomfortable, but it is the truth that keeps long-term improvement honest. Use the amateur baseline daily. Keep the tour baseline visible quarterly.
Don’t chase the wrong bracket. Be honest about your current handicap. A 17-handicap who toggles to the 10-handicap baseline to see how they compare will look terrible across the board, which is no more useful than the tour baseline view. Step up one bracket at a time.
Putting It Together: a Practical Setup
Here is the pattern we recommend most golfers use inside golfity.
- Set your default baseline to your current handicap level, rounded to the nearest bracket (5, 10, 15, 20, 25). This is the lens you will see every round through.
- Once a quarter, switch to PGA Tour for one rolling 10-round summary. Note your total SG against the tour and write it down. That is your absolute progress over time.
- When setting a goal, switch to the bracket above yours for one round. If you are a 15, look at the round against the 10-handicap baseline. The categories that look the worst there are your highest-leverage improvement targets.
- Don’t switch baselines mid-practice block. Pick one for the next 4–6 weeks of work and stay with it so you can see real movement.
This is the same idea from strokes gained benchmarks for every handicap and where to focus your practice, but in a more granular form: instead of just seeing the benchmarks, you can re-score every round you have ever played against them.
How golfity Computes Each Baseline
For curious users, the implementation matters. Each baseline in golfity is built from a separate expected-strokes table that covers all reasonable lie / distance combinations:
- Off the tee by hole length and tee shot outcome
- Fairway and rough approach by distance bands
- Greenside lies (fringe, rough, sand) by distance
- Putting by feet to the hole
The PGA Tour table is grounded in published Mark Broadie research and ShotLink-derived figures. The amateur tables are calibrated against handicap-specific datasets and tuned so that the expected score for a player at that level on a typical course matches what you would actually expect them to shoot. We dig into the math in strokes gained vs traditional golf stats and example of strokes gained calculation.
When you switch the baseline in the app, every individual shot in your history is rescored against the new table. Round totals, category averages, and the scorecard with strokes gained view all update instantly. There is no re-entry, no extra tracking, no second account. Same data, different lens.
The Bottom Line
The PGA Tour benchmark is not wrong, and it is not optional — it is the only baseline that lets you measure your absolute, decade-comparable progress against a fixed reference point. Keep it in view.
But on a daily, weekly, “should-I-practice-irons-or-putting” timescale, the right benchmark is the one calibrated to your level. An amateur benchmark stops every category from looking like a disaster, surfaces real strengths, and tells the difference between two 15-handicaps who shot the same 88 in two completely different ways.
The right answer to “PGA Tour or amateur baseline?” is both, in different moments. That is why golfity ships with seven baselines instead of one. Set the one that matches your level as your default, glance at the tour view when you want the long-arc story, and step up one bracket when you are setting your next goal. The data you have already tracked will do all of the work.
Run any shot through the strokes gained calculator to feel the shift between baselines, then go track your next round and see where you land — at your level, and against the best players in the world, on the same screen.