The Complete Guide to Strokes Gained Categories
Strokes gained breaks your game into four categories. Understanding what each one measures—and what it tells you—is the key to knowing where to improve.
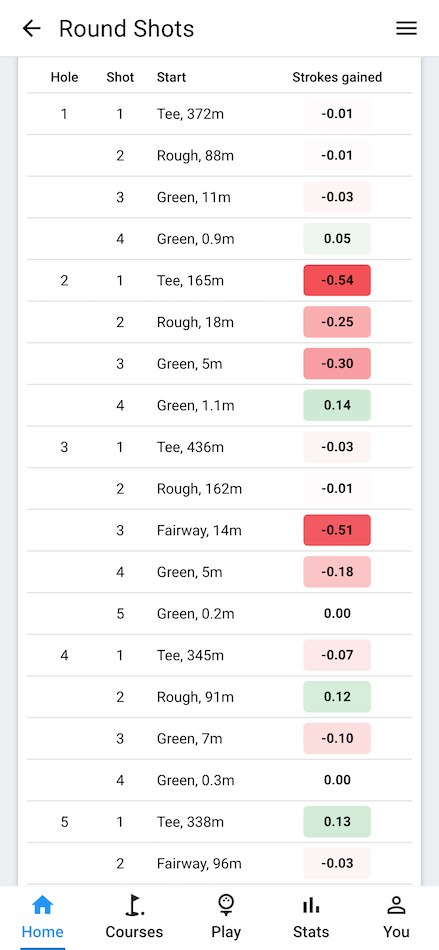
When you track a round shot-by-shot in golfity, you get a strokes gained value for every shot. But the real power comes when those shots are grouped into four categories: Off the Tee, Approach, Around the Green, and Putting.
Each category isolates a different part of your game, and together they answer the question every golfer asks: “Where am I losing strokes?”
The Four Categories at a Glance
| Category | What It Covers | Typical Shots |
|---|---|---|
| Off the Tee | Tee shots on par 4s and par 5s | Driver, 3-wood, hybrid off the tee |
| Approach | Shots from 30+ yards aimed at the green | Irons, hybrids from fairway or rough |
| Around the Green | Shots within 30 yards of the green (not on the putting surface) | Chips, pitches, bunker shots, flop shots |
| Putting | All shots on the putting surface | Putts from any distance |
This breakdown was established by Mark Broadie in his research at Columbia and is the same system used by the PGA Tour.
Off the Tee
What it measures: The combined value of distance and accuracy on tee shots for par 4s and par 5s. Par 3 tee shots are classified as approach shots since you’re aiming at the green.
Why it matters: A tee shot sets up everything that follows. A 290-yard drive in the fairway leaves a short iron approach, while a 230-yard drive in the rough leaves a long iron from a bad lie. Strokes gained off the tee captures that full picture—something fairways hit percentage never could.
What the numbers mean:
- +1.0 or higher: Elite driving. You’re gaining a full stroke per round from the tee alone.
- +0.3 to +0.9: Above average. Driving is a strength.
- -0.3 to +0.3: Average range for most golfers.
- Below -0.5: Driving is costing you. Could be distance, accuracy, or both.
Common insight: Many mid-handicap golfers discover their tee game isn’t as bad as they thought. The big misses feel terrible, but when averaged across all tee shots, the damage is often less than what’s happening on approaches.
Approach
What it measures: Any shot from 30 yards or more where you’re aiming at the green. This includes par 3 tee shots, second shots on par 4s, and second or third shots on par 5s.
Why it matters: Research consistently shows that approach play is the biggest differentiator between handicap levels. The difference between a 20-handicap and a 5-handicap is largest in the approach category. If you want to lower your scores, this is usually the place to start.
What the numbers mean:
- +1.0 or higher: Exceptional iron play. Tour-caliber approaches.
- +0.3 to +0.9: Above average. Your iron game is solid.
- -0.3 to +0.3: Average. Room to improve but not bleeding strokes.
- Below -1.0: This is likely your biggest opportunity. Improving approach play yields the fastest scoring gains.
Common insight: Approach strokes gained rewards proximity to the hole, not just hitting the green. Hitting 12 greens but averaging 40 feet from the pin is worse than hitting 9 greens averaging 15 feet. This is why GIR alone is misleading—strokes gained tells the full story.
Around the Green
What it measures: Shots from within 30 yards of the green when you’re not on the putting surface. Chips, pitches, bunker shots, and any other short-game shots.
Why it matters: Your short game is your scoring safety net. When you miss a green—and even tour players miss about a third of greens—the quality of your next shot determines whether you save par or make bogey.
What the numbers mean:
- +0.5 or higher: Your short game is a weapon. You’re saving strokes around the green.
- +0.1 to +0.4: Above average. Solid chipping and pitching.
- -0.2 to +0.1: Average range.
- Below -0.5: Short game is hurting you. Focus on getting up and down more often from common positions.
Common insight: Around the green has the smallest range of values among the four categories. Most golfers are within a stroke or two of average. But small improvements here compound quickly—saving one extra up-and-down per round is one less bogey on the card.
Putting
What it measures: Every putt, compared to the benchmark for that distance. A 3-footer and a 30-footer are measured against completely different expectations.
Why it matters: Putting accounts for roughly 40% of all strokes in a round, but contrary to popular belief, it’s often not where the biggest scoring differences exist between handicap levels. Still, putting is the one area where practice transfers most directly to the course.
What the numbers mean:
- +0.5 or higher: Excellent putter. You’re making more than your share from mid-range.
- +0.1 to +0.4: Above average on the greens.
- -0.3 to +0.1: Average. Most golfers fall here.
- Below -0.5: Putting is costing you. Check your performance by distance—the problem might be lag putting, not short putts.
Common insight: Strokes gained putting separates putting skill from approach quality. A player who hits it close will take fewer putts, but that doesn’t mean they putt well—it means they approach well. Strokes gained putting accounts for first-putt distance, so you get credit for sinking a 25-footer and aren’t penalized for two-putting from 40 feet.
How the Categories Work Together
The four categories always add up to your total strokes gained for the round. If you shot 80 on a par-72 course, your total strokes gained against the PGA Tour benchmark is roughly -8.0. That deficit is distributed across the categories:
| Category | Strokes Gained | Reading |
|---|---|---|
| Off the Tee | -1.2 | Slightly below average |
| Approach | -4.5 | Biggest weakness |
| Around the Green | -0.8 | Below average |
| Putting | -1.5 | Below average |
| Total | -8.0 |
In this example, approach play accounts for more than half the gap. Even though putting and short game aren’t great, the most efficient path to lower scores is improving iron play from 100–200 yards.
What Mark Broadie’s Research Found
Broadie’s analysis of PGA Tour data and thousands of amateur rounds revealed several patterns that hold across skill levels:
- Approach is the great separator. The gap between scratch and 20-handicap is largest in approach play.
- Driving matters more than you think. Long, reasonably accurate drives produce real scoring advantages—the data supports hitting driver more often, not less.
- Putting differences are smaller than expected. The putting gap between a 0-handicap and a 15-handicap is only about 1–2 strokes per round, while the approach gap can be 5+ strokes.
- Short game is the equalizer. Amateurs with good short games consistently outscore their ball-striking ability.
Using Your Category Breakdown
Once you’ve tracked 5 or more rounds in golfity, your category breakdown becomes reliable. Here’s how to use it:
- Find your weakest category. This is where you’re losing the most strokes and where practice gives the biggest return.
- Compare categories to each other. If your approach is -3.0 and your putting is -0.5, spend 80% of your practice time on iron shots.
- Track changes over time. After a month of focused practice, check if the target category has improved.
- Don’t ignore strengths. A positive category means you’re doing something right. Maintain it while you work on weaknesses.
The strokes gained calculator can help you understand individual shot values, but tracking full rounds gives you the category-level view that actually guides your improvement.
Start Tracking Your Categories
Every shot-by-shot round you track in golfity automatically calculates your strokes gained across all four categories. The more rounds you log, the clearer the picture becomes.
Your categories tell you exactly what kind of golfer you are—and exactly what to work on to become a better one.