Understanding Strokes Gained Putting: The Final Piece
Most golfers obsess over putting but misdiagnose their problems. Strokes gained putting separates reality from feel, showing exactly where your flatstick stands.

Putting feels like the most important part of golf. You hear it constantly: “drive for show, putt for dough.” But Mark Broadie’s research flipped this assumption on its head. Putting accounts for the smallest scoring difference between professionals and amateurs among the four strokes gained categories.
That doesn’t mean putting is irrelevant. It means most golfers misunderstand where their putting actually stands. Strokes gained putting (SG:PUTT) strips away the feel and gives you the facts.
This completes our series on the four strokes gained categories, following off the tee, approach, and around the green.
What Counts as Putting
SG:PUTT is the simplest category to define. Any stroke taken while your ball is on the putting surface counts as putting. Once the ball is holed, the putting sequence ends. Every putt from the moment you reach the green until the ball drops contributes to your strokes gained putting.
In a typical 18-hole round, you’ll take somewhere between 28 and 36 putts. That number depends on how many greens you hit, how close your approaches finish, and how well you actually roll the ball. The combination of all these putts determines your SG:PUTT for the round.
How SG:PUTT Is Calculated
The math follows the same expected strokes framework as every other category. Before you putt, your ball sits at a certain distance from the hole. That distance carries an expected strokes value based on thousands of measured putts at that length. After you putt, the ball is either in the hole or at a new distance with a new expected value.
Here’s an example. You have a 20-foot putt. Expected strokes from 20 feet: about 1.87. You roll it to 3 feet. Expected strokes from 3 feet: about 1.04.
Your strokes gained: 1.87 - 1.04 - 1 = -0.17 strokes.
You used one stroke and reduced expected strokes by 0.83, which is less than the 1.0 reduction a perfectly average putt would produce. You lost 0.17 strokes on that putt, mostly because a 3-footer is no gimme and you still face some risk.
Now say you drain the 20-footer. Expected strokes after holing out: 0.
Your strokes gained: 1.87 - 0 - 1 = +0.87 strokes gained.
One putt just added nearly a full stroke to your round. That’s the upside of holing a long one.
And the flip side: you three-putt from 20 feet. First putt to 6 feet, second putt misses, third putt drops.
First putt: 1.87 - 1.44 - 1 = -0.57 strokes Second putt: 1.44 - 1.04 - 1 = -0.60 strokes Third putt: 1.04 - 0 - 1 = +0.04 strokes
Total: -1.13 strokes from what started as a makeable birdie putt. Three-putts from inside 20 feet are scoring disasters, and SG:PUTT exposes them clearly.
What Your SG:PUTT Numbers Mean
Here’s how to interpret your SG:PUTT per round against PGA Tour baselines:
| SG:PUTT per Round | What It Means |
|---|---|
| +1.5 or higher | Elite putting. Among the best on any professional tour. |
| +0.5 to +1.5 | Excellent. Putting is a genuine strength. |
| -0.5 to +0.5 | Tour average range. Solid, competitive putting. |
| -1.0 to -0.5 | Slightly below average. Costing yourself half a stroke or more per round. |
| -2.0 to -1.0 | Below average. Putting is a drag on your scoring. |
| Below -2.0 | Significant weakness. Three-putts and missed short putts are piling up. |
For amateurs, the numbers shift but not as dramatically as other categories. A 15-handicap typically shows SG:PUTT around -1.0 to -1.5 versus scratch. A 10-handicap is closer to -0.5 to -1.0. Single-digit handicaps often putt close to scratch level, hovering around -0.3 to +0.3.
This compressed range matters. The gap between amateur and pro putting is far smaller than the gap in approach play or off the tee. Check your handicap-specific benchmarks for exact comparisons.
Why Traditional Putting Stats Lie to You
Most golfers track one thing on the greens: putts per round. It’s the easiest stat to record. But it’s nearly useless for measuring putting skill.
Here’s the problem. Putts per round is heavily influenced by your approach play and short game. A golfer who hits greens to 35 feet on average and putts “32 per round” is probably putting better than someone who sticks approaches to 15 feet and putts “29 per round.” The first golfer is facing harder putts constantly. The second golfer is making the math easier.
Consider two scenarios from the same hole:
Golfer A hits the green to 40 feet, two-putts for par. Two putts.
Golfer B misses the green, chips to 6 feet, one-putts for par. One putt.
Traditional stats say Golfer B putted better. But Golfer A executed a good lag and conversion from long range. Golfer B simply had an easier test. SG:PUTT would reveal that Golfer A’s two-putt from 40 feet (expected strokes about 2.1) that finished in the hole (-0.1 SG:PUTT total) is roughly equal to Golfer B’s one-putt from 6 feet (expected strokes about 1.4, SG:PUTT = +0.4 but minus the around-the-green work).
The stat “putts per round” obscures all of this. SG:PUTT isolates what actually happened on the green, independent of how you got there.
The Three Factors That Drive SG:PUTT
Putting strokes gained comes down to three measurable skills. Understanding which one affects your numbers most tells you exactly where to practice.
1. Make Rate on Short Putts
This is where the variance lives for amateurs. A PGA Tour player makes 99.5% of putts inside 3 feet. An average amateur makes about 95%. That 4.5% gap might seem small, but at 15-20 short putts per round, missing even two extra 3-footers costs a full stroke.
The expected strokes from 3 feet is about 1.04. From 4 feet, it’s about 1.13. From 5 feet, it’s about 1.23. Miss any of these, and you’re looking at -0.8 to -1.0 strokes lost on a single putt.
For most mid-handicappers, short putt misses are the number one putting leak.
2. Lag Putting From Long Range
Putts over 25 feet rarely go in. On Tour, make rates from 30 feet are around 6%. From 40 feet, under 3%. For amateurs, these numbers are even lower.
What matters on long putts isn’t making them. It’s avoiding the three-putt. The goal from 35 feet is to get the ball close enough that the second putt is stress-free. A lag to 2 feet is excellent (+0.25 SG). A lag to 8 feet is risky (you’ll miss about 45% of those second putts).
Three-putts from outside 25 feet are common among high-handicappers and occasionally happen even on Tour. Each one costs roughly 0.8 to 1.0 strokes. Cut your three-putt rate from 5% to 2% over a season and you’ll see it in your handicap.
3. Mid-Range Conversion (6-15 feet)
This is the “scoring range.” Putts from 8 to 12 feet are where birdies happen. Tour players make about 50% from 8 feet. Amateurs make closer to 35%.
The strokes gained math on these putts creates modest swings either way. Make an 8-footer: +0.5 strokes. Miss and tap in: -0.5 strokes. The cumulative effect across a round is meaningful but not enormous.
Where amateurs lose more ground is simply facing fewer 8-footers due to poor approach play. The best way to improve your mid-range make percentage isn’t necessarily putting drills. It’s hitting better approach shots to give yourself more chances.
How to Improve Your SG:PUTT
Your golfity data shows exactly where putts are hurting you. Here’s how to act on it.
Check Your Three-Putt Rate
This is the first number to look at. How often do you three-putt, and from what distances? If you’re three-putting from inside 25 feet more than once every two rounds, your lag putting needs work. If most three-putts come from 40+ feet, that’s more forgivable. Those are genuinely hard putts.
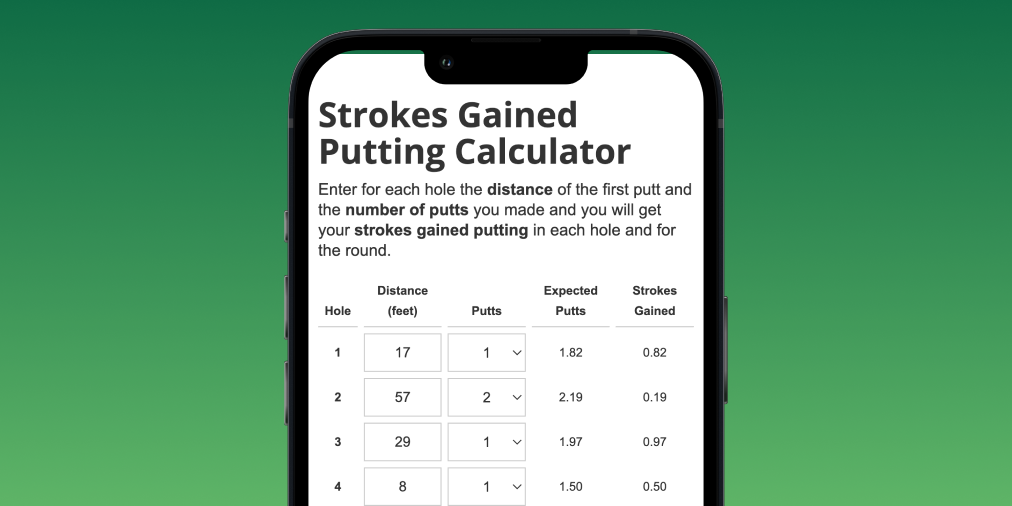
Use golfity’s putting calculator to see expected strokes from various distances and compare them to your actual results.
Track Short Putt Outcomes
Putts from 3 to 5 feet are supposed to go in. Every time they don’t, you lose roughly a full stroke. If your data shows you’re missing 10% or more of putts inside 5 feet, that’s a mechanical issue worth fixing. Speed control and alignment are the usual culprits, though nerves play a role too.
Compare First Putt Distance to Expected
After each round, look at your average first putt distance (proximity after approach). Then look at your average strokes gained per putt. If your first putts are long but your SG:PUTT is near zero, you’re actually putting well. The long putts are a symptom of approach play, not putting. If your first putts are short and your SG:PUTT is negative, you’re leaving strokes on the table.
Don’t Over-Weight Feel
Putting “feel” is unreliable. Golfers routinely think they putted great when they actually lost strokes and think they putted poorly when they gained strokes. This happens because we remember the one long putt that dropped but forget the three short ones we missed. SG:PUTT doesn’t have a memory bias. Trust the data over your gut.
Why Putting Matters Less Than You Think
This surprises most golfers. In Every Shot Counts, Mark Broadie calculated that putting accounts for only about 15% of the scoring gap between a scratch golfer and a 90-shooter. The remaining 85% splits across approach (about 40%), off the tee (about 25%), and around the green (about 20%).
The reason is range compression. Everyone can putt to some degree. The physical skill gap between a Tour player and a 15-handicap is far smaller on a 10-foot putt than on a 170-yard approach. Rolling a ball 10 feet doesn’t require elite hand-eye coordination. Hitting a 6-iron to 15 feet from 180 yards does.
That’s why putting improvements have diminishing returns compared to working on your approach game or short game. If you could magically become Tour-average in one category, choosing SG:Approach would save you more strokes than choosing SG:PUTT.
This doesn’t mean neglect putting. It means prioritize your practice based on where strokes are actually hiding, and for most amateurs, that’s not on the greens.
SG:PUTT in the Bigger Picture
Putting is the only category where many mid-handicappers are roughly competitive with scratch players. A 10-handicap might lose 3 strokes per round on approach but only 0.5 strokes putting. Fixing the approach game delivers six times the scoring improvement.
But for low-handicappers already hitting quality approaches, putting becomes proportionally more important. A 2-handicap who gains strokes on every other category but loses 0.5 putting can get to scratch by focusing on the greens. Context matters.
The interaction between categories also matters. Better approaches mean shorter first putts, which leads to better putting numbers even without improving your stroke. Better chips mean more tap-ins. Your SG:PUTT improves when other parts of your game improve, which is why it’s the last category to optimize, not the first.
Start Measuring Your Putting
Recording your putts in golfity gives you SG:PUTT automatically. Track the distance of each putt and whether it went in. The app runs the expected strokes calculations and shows you exactly how your putting stacks up.
After 15 or more rounds, patterns will emerge. You’ll know whether short putts, lag putts, or mid-range make rates are your primary weakness. You’ll see your three-putt frequency broken down by starting distance. And you’ll have an objective measure to compare against your handicap benchmarks.
Putting is the smallest piece of the strokes gained puzzle for most golfers, but it’s still a piece. Measure it, understand it, and prioritize your practice accordingly.