Traditional Golf Stats in golfity: GIR, Fairways, and Putting Average
Track traditional golf stats like greens in regulation, fairways hit, and putting average alongside strokes gained analysis in golfity.
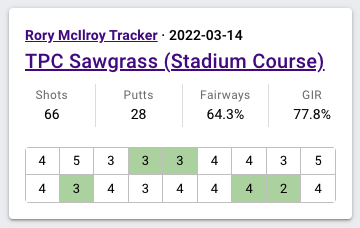
Traditional golf statistics—greens in regulation, fairways hit, putts per round—have been the standard measures of golf performance for decades. While strokes gained analysis provides deeper insights for improvement, traditional stats remain valuable for quick performance snapshots and comparing yourself to historical benchmarks.
golfity tracks both. You get the familiar stats you’ve always used plus the advanced analytics that actually drive improvement.
Understanding Traditional Stats with Real Round Data
Consider Rory McIlroy’s final round at The Players Championship: a 66 (6 under par) with 28 putts, hitting 64% of fairways (9 of 14) and 77% of greens in regulation (14 of 18).
These numbers tell a story at a glance—but they also illustrate why traditional stats have limitations.
Scoring Distribution Analysis
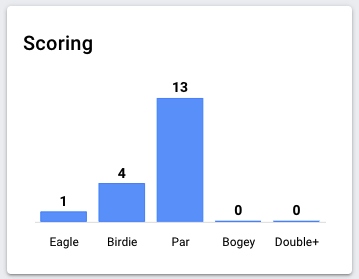
golfity breaks down your scoring by hole type. Rory’s round showed no bogeys, four birdies, and one eagle—a model of consistency:
The par-specific breakdown reveals more:
| Hole Type | Score vs. Par | Average Strokes |
|---|---|---|
| Par 5s | -3 | 4.3 |
| Par 4s | -2 | 3.8 |
| Par 3s | -1 | 2.75 |
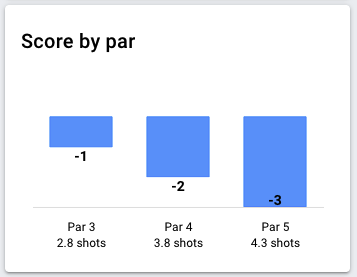
As a long hitter, Rory excelled on par 5s, but his performance held strong across all hole types. Traditional stats capture this high-level picture well.
Greens in Regulation by Hole Type
GIR percentage is one of golf’s most predictive traditional stats—higher GIR correlates strongly with lower scores. But aggregate GIR hides important details.
Rory’s GIR breakdown:
- Par 5s: 100% (3 of 3)—reached every par 5 in regulation
- Par 4s: 80% (8 of 10)—missed only 2 par 4 greens
- Par 3s: 50% (2 of 4)—reached only half the par 3 greens
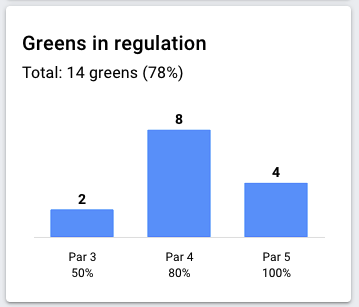
This pattern is common among long hitters: they overpower par 5s and longer par 4s but can struggle with short iron approaches on par 3s where precision matters more than power.
golfity shows you these patterns in your own game, helping you identify where your approach play succeeds and where it needs work.
Putting Statistics and Their Limitations
Rory averaged 1.6 putts per hole (28 putts in 18 holes) and maintained the same 1.6 average on greens hit in regulation.
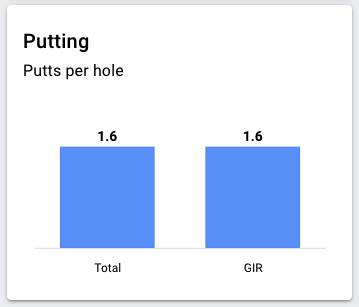
This consistency is unusual. Typically, GIR putts are longer than average (you’re entering the green from approach distance rather than from a chip), so GIR putting averages should be higher than overall putting averages.
Rory’s equal numbers suggest either exceptional lag putting or that he was getting his approach shots close enough to offset the distance disadvantage.
This is exactly where traditional stats fall short. Putts per round doesn’t tell you:
- How difficult your putts were
- Whether you made putts you “should” make
- How your putting compared to tour average from similar distances
For these insights, you need putts gained analysis.
Where Traditional Stats Help (and Where They Don’t)
Traditional stats work well for:
- Quick round summaries
- Tracking broad trends over time
- Comparing yourself to historical benchmarks
- Casual conversation about your game
Traditional stats fall short for:
- Identifying specific weaknesses
- Understanding shot quality independent of outcome
- Comparing performance to skill-appropriate baselines
- Making data-driven practice decisions
A 75% GIR sounds great—but if you’re hitting every green to 40 feet, you’re leaving strokes on the table. A 30-putt round sounds poor—but if every putt was from 25+ feet, you actually putted well.
Getting Complete Golf Analytics
golfity gives you traditional stats as a starting point and strokes gained analysis for deeper understanding. View your fairway percentages and GIR on the summary screen, then dig into strokes gained by category to see where you’re actually gaining and losing strokes.
The combination provides both the familiar benchmarks you expect and the actionable insights you need. Check out our strokes gained calculator to see how your shots stack up against baseline expectations.