Strokes Gained on the Home Page: Quick Stats for Every Round
View strokes gained stats for each round directly in your golfity home feed with visual charts showing performance at a glance.
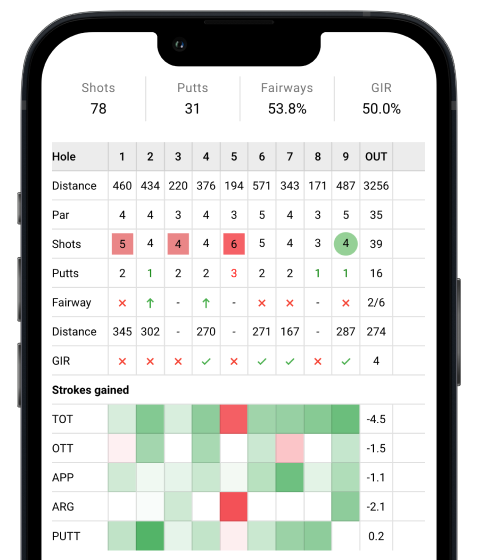
Every round you track in golfity now shows a quick strokes gained overview right on your home feed. This visual chart displays your performance in each of the four PGA Tour categories—off-the-tee, approach, around-the-green, and putting—without needing to open the full round details.
Reading Your Home Feed Strokes Gained Chart
The chart uses a simple bar visualization:
- Bars extending right: Positive strokes gained (you outperformed the baseline)
- Bars extending left: Negative strokes gained (you underperformed)
- Longer bars: Larger gains or losses
Each round shows four categories:
- OTT: Off-the-tee performance (tee shots on par 4s and 5s)
- APP: Approach shots (including par 3 tee shots)
- ARG: Around-the-green (shots within 30 yards of the green)
- PUTT: Putting performance on the greens
Quick Performance Assessment at a Glance
Scrolling through your feed, you can instantly identify:
Your best rounds: Look for charts where most bars extend right, showing positive strokes gained across multiple categories.
Problem areas: A consistently leftward bar in one category (like putting) across multiple rounds suggests a pattern worth addressing.
Outliers: A round with one extremely long left-extending bar stands out—something went wrong in that category that day.
Example: Jordan Spieth Analysis
The sample image shows a round where the strokes gained chart reveals:
- Strong performance with driver and long irons (OTT and APP bars extending right)
- Significant struggles with putting (PUTT bar extending far left)
Traditional stats might show “29 putts” for that round, but strokes gained reveals the putting was actually below average relative to the distances faced. Maybe he had many short putts due to excellent approach play, making 29 putts a disappointing result.
Why Home Feed Stats Matter for Improvement
Pattern Recognition
When you can see 10+ rounds at a glance, patterns emerge:
- “My putting chart is consistently neutral—not a problem area”
- “I lose strokes around the green almost every round”
- “My best rounds always have positive OTT”
These patterns guide practice decisions better than reviewing one round at a time.
Progress Tracking
After working on your short game for a month, scroll through recent rounds. Has the ARG bar been extending further right (or at least not as far left)? Visual feedback like this reinforces that your practice is working—or signals that you need a different approach.
Quick Round Review
Between meetings or during lunch, scan your feed to review recent rounds. No need to open each one for a full analysis when you just want to remember how you played last weekend.
Connecting to Deeper Analysis
The home feed chart is a summary view. For complete shot-by-shot breakdowns, tap any round to see the full scorecard with strokes gained data by hole.
You can also view strokes gained for individual shots to identify exactly which shots gained or lost strokes—perfect for understanding why a particular category shows positive or negative results.
Getting Your Strokes Gained on the Home Feed
Every round tracked shot-by-shot in golfity automatically generates strokes gained data, which appears on your home feed. The more rounds you track, the more valuable the pattern recognition becomes.
Start tracking your rounds with golfity to see your strokes gained stats just like the PGA Tour pros. Within a few rounds, you’ll have a visual history showing exactly where you gain and lose strokes—and a clear roadmap for improvement.
Use the strokes gained calculator to understand how individual shots contribute to these category totals, or read our strokes gained overview for a complete explanation of the methodology behind these numbers.