How to Compare Golf Stats With a Friend Without Making It About Ego
Two golfers who both shoot 89 rarely shoot it the same way. Here is how to compare golf stats side by side in golfity so the conversation ends with something to practice instead of someone feeling small.

Most golf comparisons start and end with one number. You shot 84, your regular partner shot 81, and that is the whole conversation. Three strokes, a bit of needling in the car park, no information.
The compare players screen in golfity exists because that number hides almost everything interesting. When you compare golf stats side by side instead of totals, two golfers who shoot the same score turn out to be playing completely different games. One is short off the tee and never in trouble. The other is 30 yards longer and gives four shots back from the trees. Same 84, opposite problems, opposite practice plans.
What the Compare Screen Shows
Open a player’s profile in golfity and tap Compare. You get their numbers next to yours across seven bars:
- Number of rounds
- Average score
- Fairways hit
- Average driving distance
- Greens hit
- Putts per round
- Awful shots per round
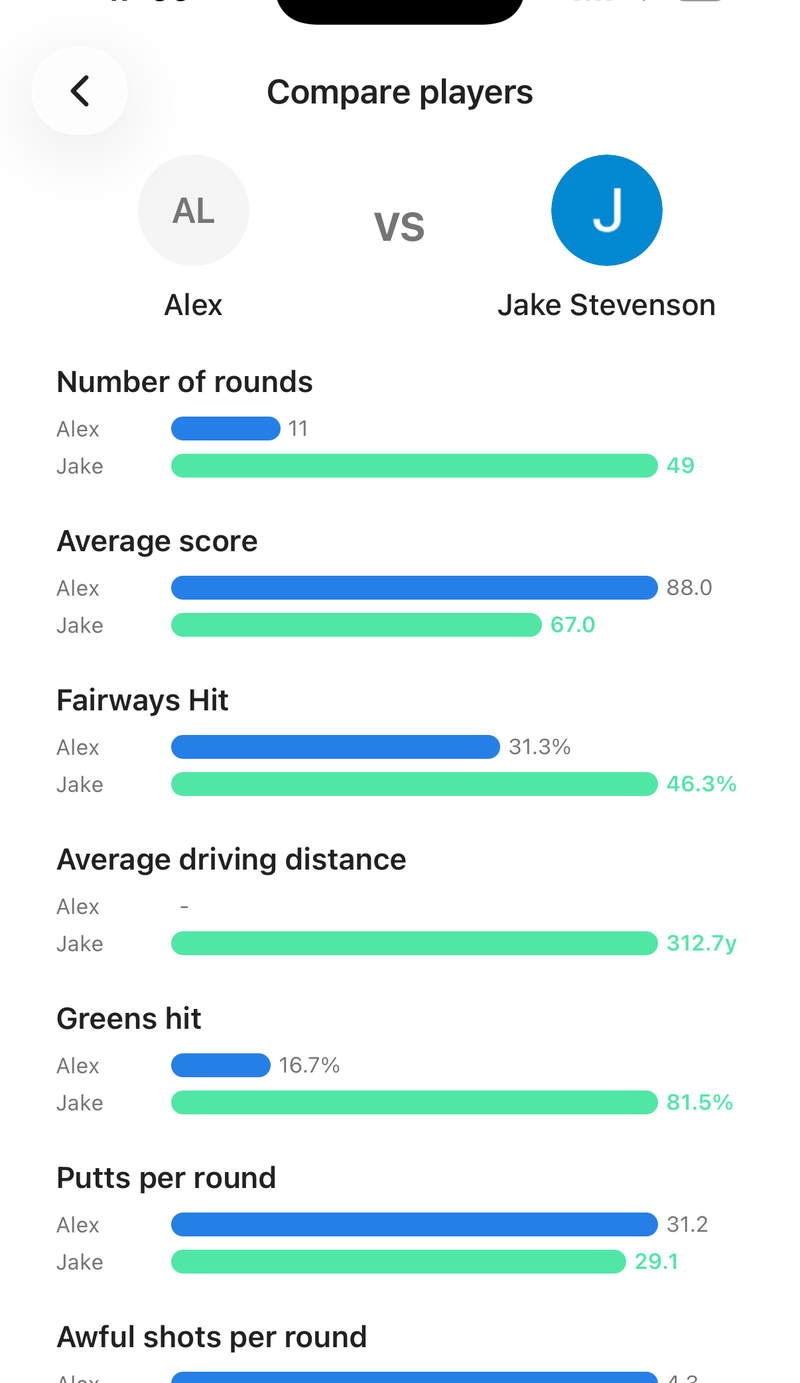
Below that sits a strokes gained chart with both players broken into the four categories: off the tee, approach, around the green, and putting. You can switch the benchmark on that chart, so you can view both games against a tour player or against a level closer to your own.
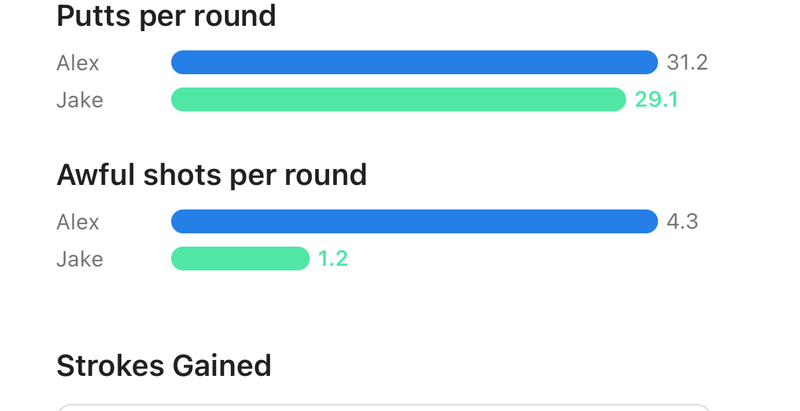
The bars matter less than the shape they make together. A single stat in isolation invites a winner. Seven stats plus a strokes gained breakdown invites an explanation.
Two 89s, Two Different Games
Here is what a real comparison tends to look like between two mid-handicap friends:
| Stat | Player A | Player B |
|---|---|---|
| Average score | 89.2 | 89.0 |
| Fairways hit | 61% | 38% |
| Driving distance | 218y | 254y |
| Greens hit | 22% | 31% |
| Putts per round | 33.1 | 30.4 |
| Awful shots per round | 1.4 | 3.6 |
And the strokes gained view against a 10 handicap:
| Category | Player A | Player B |
|---|---|---|
| Off the Tee | -1.2 | +0.4 |
| Approach | -1.9 | -1.6 |
| Around the Green | -0.6 | -1.5 |
| Putting | -1.8 | -0.1 |
| Total | -5.5 | -2.8 |
Two rounds that finish within a fifth of a stroke of each other. Player A hits it straight, can’t get it close, and putts poorly. Player B is the longer player who gains off the tee and putts well, but throws away shots when he misses a green and averages 3.6 awful shots a round.
Neither of them is the better golfer. They are the same golfer with different leaks. Player A has 1.8 strokes waiting on the practice green. Player B has 1.5 strokes waiting in his short game and a wild-shot problem that no amount of driver work will fix.
That is a conversation worth having on the drive home. “I beat you by three” is not.
Rules That Keep It Useful
Compare shapes, not totals. Total strokes gained is a ranking. The category split is information. Look at which category is furthest from zero for each player before you look at who is ahead overall.
Check the round count first. The top bar is number of rounds for a reason. Someone with 6 tracked rounds and someone with 60 are not on equal footing, because a couple of hot putting days can swing a small sample by a full stroke per round. Averages settle down somewhere around 10 to 15 rounds.
Use the same benchmark for both players. The strokes gained chart lets you switch the reference player. Everything shifts when you do, so make sure you are reading both columns against the same one. If you are both mid-handicaps, a 10-handicap benchmark will separate your games more clearly than a tour benchmark, which buries both of you in negative numbers.
Expect the handicap not to match. A player with the lower handicap will lose some categories. This is normal and it is what strokes gained is built to reveal. Handicap is one number for a whole game. Strokes gained is four numbers, and nobody wins all four.
Ask what the other player does well. The most useful question after a comparison is not “why am I behind here?” It is “what are you doing on approach that I’m not?” Your partner’s best category is a live example of something that is possible from a game roughly like yours, which is more useful than a tour average.
Where It Gets Genuinely Competitive
Comparison works best when the two of you agree on what you are competing over, and it is rarely the score.
Pick one category and race in it. Both of you track putting for six weeks and see who moves further, measured in strokes gained rather than putts per round, since putt totals lie depending on how close your approaches finish. Or compete on awful shots per round, which is the fastest-moving number in most amateur games and has nothing to do with talent.
Movement is a fairer contest than level. One of you may have played since childhood. Neither of you gets a head start on improvement.
Getting to the Screen
Comparison lives on the player profile. Open the profile of someone you play with, tap Compare, and both sets of stats load side by side. It is part of golfity Pro, along with club-level stats and full graph history.
If your partner does not track rounds yet, the comparison is still worth setting up. Their first ten rounds of data will tell them more about their game than the last ten years of scorecards did, and you will finally have something to argue about that has an answer.