Automatic Insights: golfity Tells You What Cost You Strokes
You do not have to read a single chart to find out what went wrong. Save a round and golfity hands you two short lists: what you did well, and what cost you strokes.

Most golf stats apps hand you a wall of numbers and leave the interpretation to you. You get four strokes gained bars, a putting table, a fairways percentage, and no idea which one deserves your Saturday morning. golfity’s automatic golf insights skip that step. Save a round and the app writes you two short lists in plain sentences: what you did well, and what cost you strokes.
The insights slide is one of six cards in the post-round carousel. Positive lines get a check glyph, negative lines get an alert glyph, and the whole thing fits on one screen.
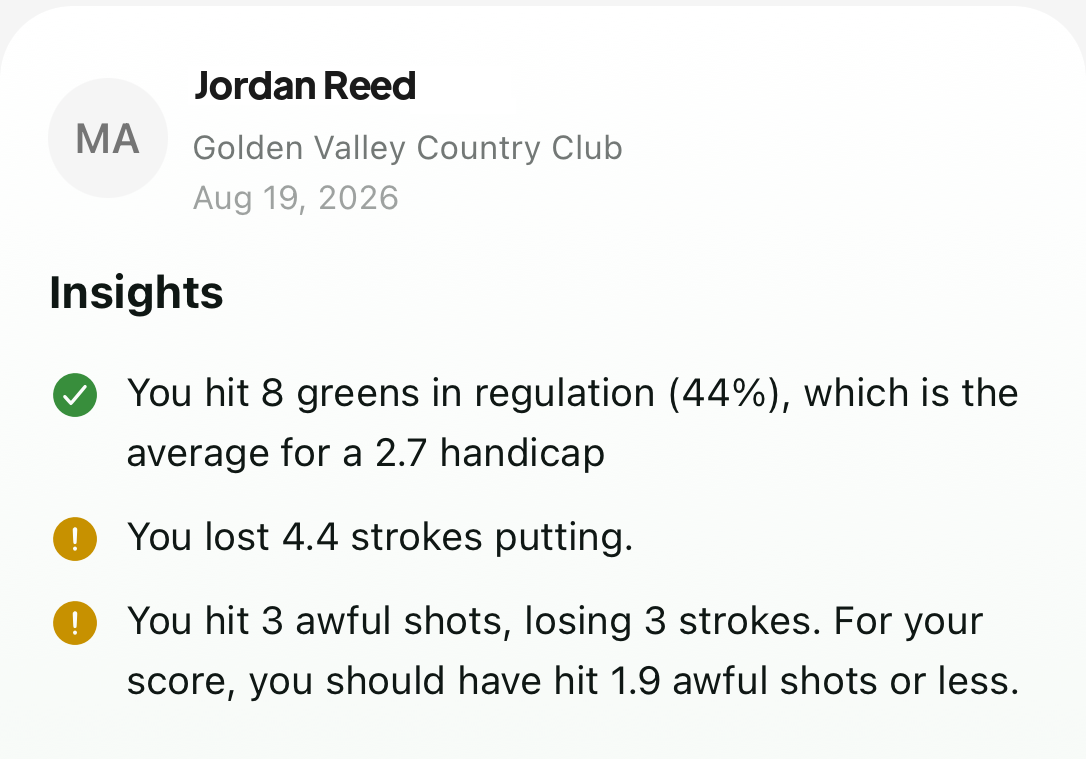 A real round’s insights card: greens in regulation came out as the strength, putting and awful shots as the weaknesses.
Typical output looks like this:
✓ You won 1.2 strokes in approach shots. ✓ You hit 9 greens in regulation (50%), which is the average for a 12.4 handicap ⚠ You lost 1.8 strokes putting. ⚠ You hit 5 awful shots, losing 3.2 strokes. For your score, you should have hit 2 awful shots or less.
How golfity decides what counts as a weakness
The grading behind those sentences is what makes them worth reading. golfity doesn’t measure you against a tour player and tell every 18-handicap that their approach play is bad. It measures you against yourself.
After each round, golfity converts nine different parts of your game into an implied handicap — the handicap level a golfer would typically have if they played that part of the game the way you just did. It does this for:
- Birdies made
- Double bogeys made
- Fairways hit
- Greens in regulation
- Awful shots
- Strokes gained off the tee
- Strokes gained on approach shots
- Strokes gained around the green
- Strokes gained putting
Nine categories, nine implied handicaps. Average them and you get the baseline for that round. If your birdie rate says 14, your putting says 21, and your approach play says 11, the round’s baseline sits somewhere in the mid-teens.
Then golfity looks for the outliers. Any category more than half a standard deviation worse than your own baseline becomes a weakness. Any category more than half a standard deviation better becomes a strength. You get at most three of each, so the slide never turns into the wall of numbers it was meant to replace.
Half a standard deviation is a deliberately loose threshold. A round where every category lands within a stroke of the others produces no insights at all, which is the correct answer: nothing stood out, you played evenly, go play again.
Why grading against yourself matters
A 20-handicap and a 5-handicap can both lose 1.5 strokes putting in a round. For the 20-handicap that might be an ordinary day at the office while their tee shots quietly bleed four strokes. For the 5-handicap it’s the worst part of their round by a mile.
An absolute benchmark tells both players the same thing. The relative one tells each of them where their own round actually leaked, which is the only version you can act on. This is the same reasoning behind comparing yourself to a 10-handicap instead of a pro when you read your strokes gained numbers.
The honest details
Two behaviors are worth knowing about, because they stop the slide from flattering you or piling on.
A weakness only appears if you actually lost strokes there. If putting was your worst category but you still gained 0.3 strokes on the greens, golfity says nothing. Being your own weakest link isn’t a crime when the link held.
A strength can still be a loss. When your best category lost ground in absolute terms, the wording changes to reflect it: “You only lost 0.4 strokes around the green.” That was the best part of a bad round, and the sentence says so without pretending otherwise.
Awful shots get their own treatment
Awful shots are the one category with a benchmark attached to the callout. golfity counts the shots that were genuinely wasted, and compares that count to what a golfer shooting your score should have hit.
You hit 5 awful shots, losing 3.2 strokes. For your score, you should have hit 2 awful shots or less.
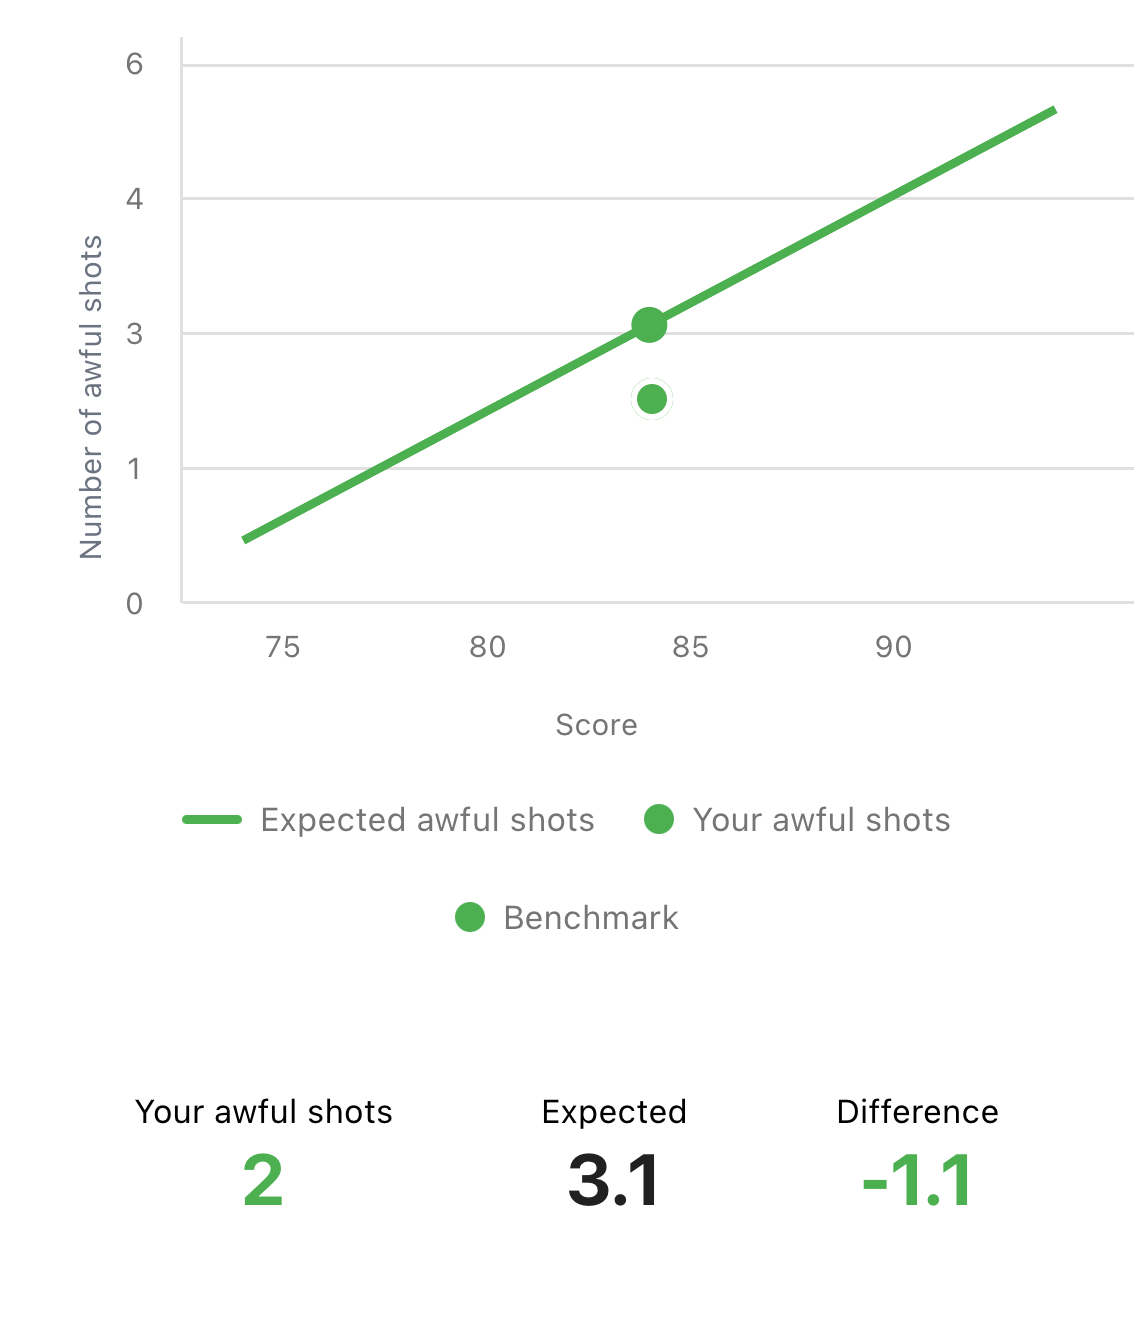 Where that benchmark comes from: the line is the expected number of awful shots for a given score. For a round of 84, golfity expects 3.1 — this one had 2.
That second sentence is the useful one. Everyone hits bad shots. The question is whether you hit more of them than your scoring level explains, and for most amateurs the answer is yes. Cutting awful shots is usually the fastest available route to a lower score, ahead of anything you could gain by getting better at a skill.
What you need for insights to appear
Insights are built from the same round stats that feed your strokes gained breakdown, so they need a shot-by-shot round. Track a round in totals mode and you’ll get the summary and scorecard slides, but the insights slide has nothing underneath it to analyze.
Once the round is saved, the slide is right there in the post-round carousel, and it stays with the round afterwards. If you want the fuller picture behind a callout, the round summary has the charts the insight was drawn from.
Read the two lists, pick the one weakness you can do something about before your next round, and ignore the rest. That’s the entire workflow.