Strokes Gained on the PGA Tour: The Four Categories Explained
Learn about the four strokes gained categories used by the PGA Tour and how golfity brings this same analysis to amateur golfers.
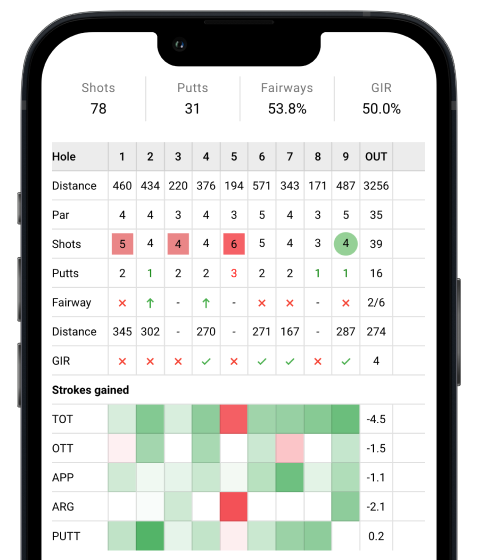
In 2011, the PGA Tour introduced strokes gained statistics, fundamentally changing how professional golf performance is measured. Unlike traditional stats (fairways hit, greens in regulation, putts per round), strokes gained isolates the actual value of each part of a player’s game relative to the competition.
The methodology comes from Mark Broadie’s research at Columbia Business School, which analyzed hundreds of thousands of shots to create benchmark expectations for different positions on the course.
How the PGA Tour Categorizes Strokes Gained
The PGA Tour initially measured only total strokes gained and “strokes gained: putting.” In 2016, they expanded the system to four categories that comprehensively cover every shot in a round.
Strokes Gained: Off-the-Tee (OTT)
What it measures: Tee shot performance on par 4s and par 5s only.
How it works: Compares where a player’s drive ends up (distance and lie) against the tour average from that tee. A player who consistently finds the fairway at 300+ yards will have positive OTT; a player hitting short or into trouble will have negative OTT.
Example: A player hits their drive 285 yards into the fairway, leaving 175 yards to the hole. The tour average from that tee might leave 180 yards with a similar lie. That extra 5 yards closer, in the fairway, gains approximately +0.03 strokes.
Strokes Gained: Approach-the-Green (APP)
What it measures: All approach shots to the green, including par 3 tee shots.
Specifically includes:
- Second shots on par 4s
- Second and third shots on par 5s (when not around-the-green)
- Tee shots on par 3s
What it excludes: Shots within 30 yards of the green edge (those go into ARG) and all putts.
Example: From 150 yards in the fairway, a player hits to 12 feet. The tour average from that position might leave them at 28 feet. Getting 16 feet closer than average gains approximately +0.35 strokes.
Strokes Gained: Around-the-Green (ARG)
What it measures: Any shot within 30 yards of the green’s edge that is not on the putting surface.
This includes:
- Chips and pitches
- Bunker shots from greenside bunkers
- Flop shots
- Any shot from rough, fringe, or sand close to the green
Example: From a greenside bunker 20 yards from the hole, a player splashes out to 6 feet. Tour average from that position might leave 10 feet. Ending up 4 feet closer gains approximately +0.08 strokes.
Strokes Gained: Putting (PUTT)
What it measures: All shots taken on the putting surface.
How it works: Compares actual putts taken to the expected number based on starting distance. A player who holes a 25-footer gains strokes; a player who three-putts from 30 feet loses strokes.
Example: A player holes a 15-foot putt. Tour average from 15 feet is approximately 1.78 putts to finish. Taking only 1 putt gains +0.78 strokes.
The Math Behind the Categories
Total strokes gained equals the sum of all four categories:
Total SG = OTT + APP + ARG + PUTT
For any given round, this total represents how many shots better (or worse) a player performed compared to the field average. A player shooting 68 while the field averages 72 would have approximately +4.0 total strokes gained.
The categorical breakdown shows where those strokes came from. A player might have:
- OTT: +1.5 (excellent driving)
- APP: +0.5 (solid approaches)
- ARG: -0.3 (slightly weak short game)
- PUTT: +2.3 (outstanding putting)
- Total: +4.0
Why Strokes Gained Beats Traditional Stats
Traditional Stats Mislead
Consider two players who both hit 65% of fairways:
- Player A averages 310 yards when in the fairway
- Player B averages 260 yards when in the fairway
Traditional stats show identical fairway accuracy, but Player A’s OTT strokes gained will be significantly higher because their approach shots are much shorter.
Similarly, two players with 31 putts might have very different putting strokes gained. One faced 15-footers all day (good approaches); the other had 35-footers (poor approaches). The player with longer putts and the same total had better putting, despite identical putt counts.
Strokes Gained Isolates True Performance
Each category measures only what that phase of the game contributed. If you hit every green but leave yourself 50-footers, your approach strokes gained suffers while your putting strokes gained gets evaluated fairly based on those difficult distances.
This isolation enables accurate diagnosis. Mark Broadie’s research showed that most amateur golfers overestimate the importance of putting relative to approach shots—a finding only visible through strokes gained analysis.
Getting PGA Tour-Style Strokes Gained for Your Game
The same analysis that tour pros use is available to every golfer through golfity. Track your rounds shot-by-shot, and you’ll see your personal strokes gained breakdown in all four categories on the home page feed and in the detailed scorecard view.
Sign up for golfity to start tracking your strokes gained. Enter a few rounds with shot-by-shot data, and you’ll know exactly where to focus your practice to lower your scores most efficiently.
Want to understand the math behind individual shots? Use the strokes gained calculator to see how any shot from any position affects your expected score.
More information: Strokes Gained: How It Works (PGA Tour)