Back Nine Collapses: Identifying the Pattern
Almost every golfer believes they fall apart on the back nine. The hole-by-hole data says most of them are wrong, and the ones who are right usually have a specific, fixable cause.

Ask a golfer how their round went and you will often hear a version of the same story: “I was two over through nine and then it all fell apart.” The front nine gets described in detail. The back nine gets summarized as a collapse. It is the most common narrative in amateur golf, and your back nine performance data is the only thing that can tell you whether it is true.
For most golfers it is not. The average gap between front and back is smaller than the story suggests, and a large share of it comes from the course rather than the golfer. But some players genuinely do fade, and for them the pattern is specific enough to fix.
What back nine performance data actually shows
In amateur tracking data the back nine usually comes in half a stroke to a stroke and a half worse than the front. That sounds like confirmation until you account for what the two nines are.
Back nines are frequently harder by design. Architects tend to save the demanding closing stretch for the finish, and the scorecard usually admits it. Look at your home course: add up the yardage for holes 1 through 9 and 10 through 18, then count how many of the nine lowest stroke-index holes sit on each side. It is common to find the back nine 200 yards longer with six of the nine hardest holes. A golfer who shoots 41-44 there is not collapsing. They are shooting the same golf on a harder nine.
There is also a warm-up effect running the other way. Plenty of golfers post their worst three-hole stretch on holes 1 through 3, when they have hit six range balls and are still finding the swing. That early damage inflates the front nine and hides a genuine back nine problem.
Three patterns that look identical on the scorecard
A 40-46 split can be produced three different ways, and the fix is different for each.
The single blow-up. Eight holes at bogey-or-better and one quadruple on the 14th. Nothing has degraded. One hole detonated. The giveaway is that your median hole score is unchanged between nines while the average jumps. This is a course management problem, not a fatigue problem, and it is covered in what blow-up holes cost you.
The drift. Every hole is a fraction worse. No disasters, just bogeys where the front nine produced pars. The scores creep from 4.4 per hole to 4.9. This is the pattern that actually deserves the word fatigue.
The cliff. Fine through 13, then four or five holes fall apart at once. This points to a trigger rather than gradual decline: a bad hole, or the moment you looked at the card and realized what you were shooting.
You cannot tell these apart from nine-hole totals. You need the hole-by-hole numbers.
How to test it with your own data
One round proves nothing. Nine-hole scores for a mid-handicapper have a standard deviation of roughly three strokes, so a 40-46 split happens regularly by chance alone. Use 10 to 15 rounds minimum, and lean toward more if you play several different courses.
The test has three steps.
- Average your front and back nines separately across those rounds. Note the raw difference.
- Subtract the structural difference. If you play mostly one course, use its stroke indexes and yardage to estimate how much harder the back nine is for everyone. What remains is yours.
- Split it by strokes gained category. The cause shows up here or nowhere.
That last step is what turns a complaint into a diagnosis. A typical breakdown for a 15-handicapper who believes they collapse looks like this:
| Category | Front nine SG | Back nine SG | Difference |
|---|---|---|---|
| Off the tee | -1.2 | -1.9 | -0.7 |
| Approach | -2.1 | -2.4 | -0.3 |
| Around the green | -0.9 | -1.0 | -0.1 |
| Putting | -0.8 | -0.7 | +0.1 |
| Total | -5.0 | -6.0 | -1.0 |
One stroke of decline, and 70 percent of it sits in the tee shot. Putting is flat. That is a useful finding, because it rules out the explanations most golfers reach for first.
Physical fatigue shows up in full-swing categories before it shows up anywhere else. Driver and long irons depend on clubhead speed and sequencing, and both degrade when you are tired. Putting depends far less on energy, so a putting-only decline points at frustration and pace of play rather than tiredness. If your losses are spread evenly across all four categories, the cause is probably attention rather than the body.
What actually causes the fade
Four explanations account for most real back nine decline.
- Fuel and heat. A round is four and a half hours and roughly 10,000 steps, often in the sun. Golfers who eat once at the turn are running on nothing by the 15th. The tee shot goes first.
- Waiting. Pace slows as the day fills up. Ten minutes standing on a tee is enough to lose whatever rhythm the front nine built, and the effect concentrates in the afternoon.
- Score awareness. Golfers who know they are playing well start protecting. Those who know they are playing badly stop caring. Both change decisions, and both show up in the last six holes.
- Recovery-mode spirals. A double bogey on 12 leads to an aggressive line on 13, which leads to another double. This is the mechanism behind most cliffs, and it is the same one described in double bogey avoidance.
Match the fix to what you found
If the gap disappears once you account for course difficulty, there is nothing to fix. Recalibrate the expectation and stop treating a normal back nine as a failure, because that alone prevents the pressing that creates real collapses.
If it is a blow-up problem, work on the decision that starts them rather than the swing. One conservative choice on the tee of your worst hole is worth more than an hour on the range.
If it is driving, test the simplest explanation first. Eat at hole 12 rather than at the turn, drink water every three holes, and see whether the pattern survives three rounds of that. It often does not.
If it is the last three holes specifically, the issue is attention, not fitness. Nobody is physically exhausted by hole 16 at a walking pace. That stretch is where score awareness peaks.
Track it hole by hole
golfity records strokes gained on every shot, so the front-versus-back comparison is already in your data. The scorecard view shows the gained or lost figure hole by hole, which is what separates a drift from a single blow-up at a glance.
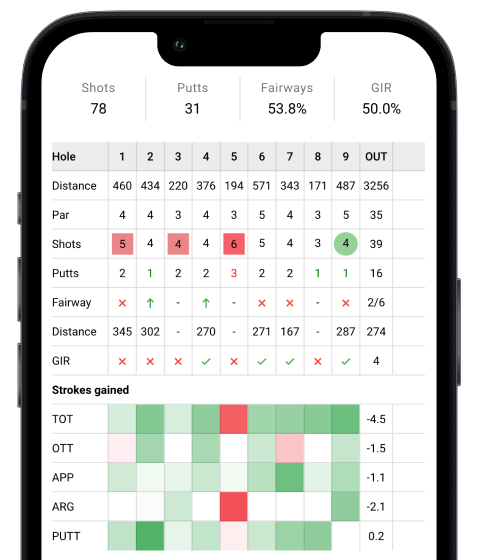
Once you have 10 rounds in, your stats history makes the pattern obvious across rounds rather than within one. A single bad back nine is noise. The same shape ten times is a signal.
Most golfers who are convinced they collapse on the back nine are playing the same golf on a harder set of holes and remembering it worse. The minority with a genuine fade almost always have one identifiable cause, and it is more often a sandwich than a swing.