How to View Your Golf Stats History in golfity
One round tells you almost nothing. The stats tab in golfity pulls every round you have logged into one view, and the filter turns that pile of data into a before-and-after you can act on.

A single round lies to you. Shoot 84 and you played well; shoot 96 and the wheels came off. Neither number says whether your putting is improving. Your golf stats history does, and in golfity it sits one tab away, pooling every round you have logged into averages, charts, and a round-by-round table you can scroll back through.
Where your golf stats history lives
Open the Stats tab. What loads is not a single screen but a stack of pages you swipe through sideways, with dots at the top marking your place. Tap a dot to jump straight to a page.
The pages that appear depend on what you have tracked:
- Summary: rounds, holes, and shots logged, scoring average, fairways, GIR, putts per round, plus your best and worst 18 holes
- Scores: your score trend, round by round
- Scoring: how often you make eagles, birdies, pars, bogeys, and worse
- Accuracy: where your misses go
- Putting: putts by distance and by hole
- Strokes Gained: the four-category breakdown across your whole history
- Strokes Gained Last Rounds: the same four categories, one row per round
- Awful Shots: the shots costing you the most
- Handicap: what your shot data implies about your level
A page only shows up when there is data behind it. Track a few rounds shot by shot and the strokes gained pages appear; log everything as a total score and they stay hidden.
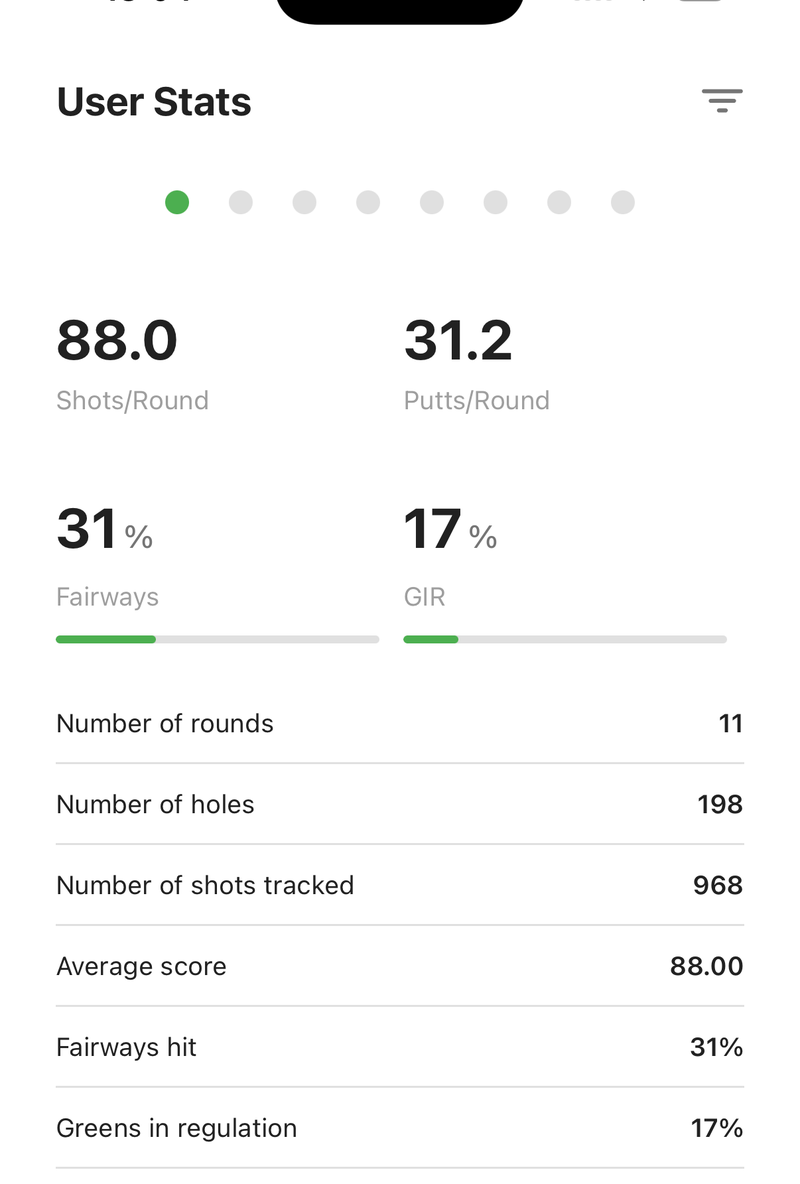
Filter the history to the stretch you care about
The filter icon sits in the top-right corner of the stats header. Tap it and a sheet slides up with two ways to narrow your history.
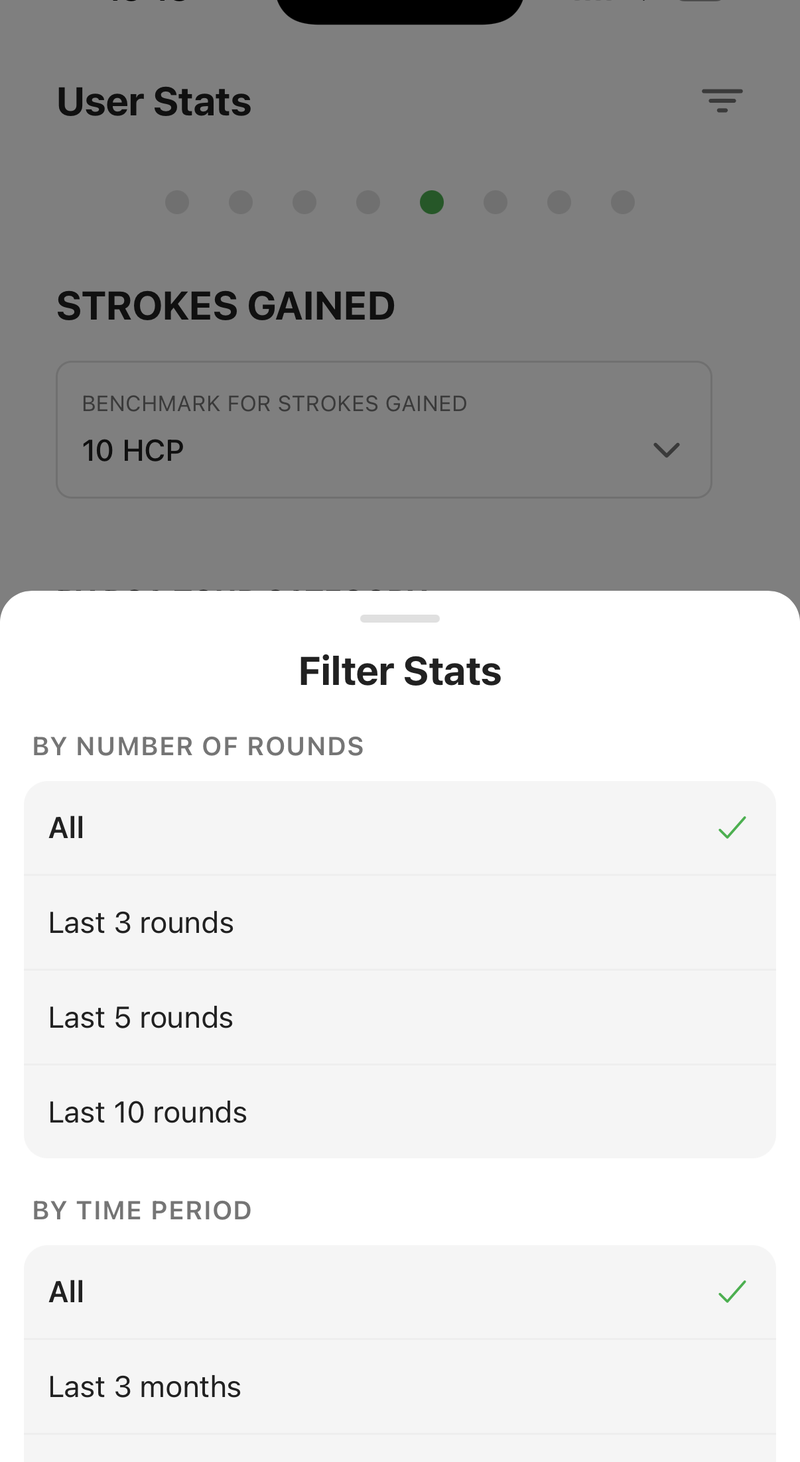
By rounds gives you the last 3, 5, or 10 rounds. By period gives you the last 3, 6, or 12 months. Pick one and every page behind the sheet recalculates for that slice. The icon turns green while a filter is on, and a green line under the “Stats” title spells out what you are looking at, so you never misread a filtered average as your all-time number.
This is where history stops being trivia. Set the filter to your last 5 rounds, note your scoring average, then switch back to All and compare. An all-time average of 92 against 88 over the last five is a real trend. If the last five come back worse, that is worth knowing before you go shopping for a new driver.
Your choice sticks. golfity saves the filter, so the app opens on the same slice next time rather than resetting to everything you have ever played. Filtering is part of the golfity subscription; the unfiltered view of your full history is free.
Small samples come with a catch. Three rounds is enough to spot a putting streak and nowhere near enough to conclude your driving has changed. How many rounds you need for accurate golf stats covers where each stat settles down.
If a filter returns nothing, golfity tells you no rounds match and offers a button back to your full stats. That usually means a six-month gap in play, not missing data.
Reading the Scores page
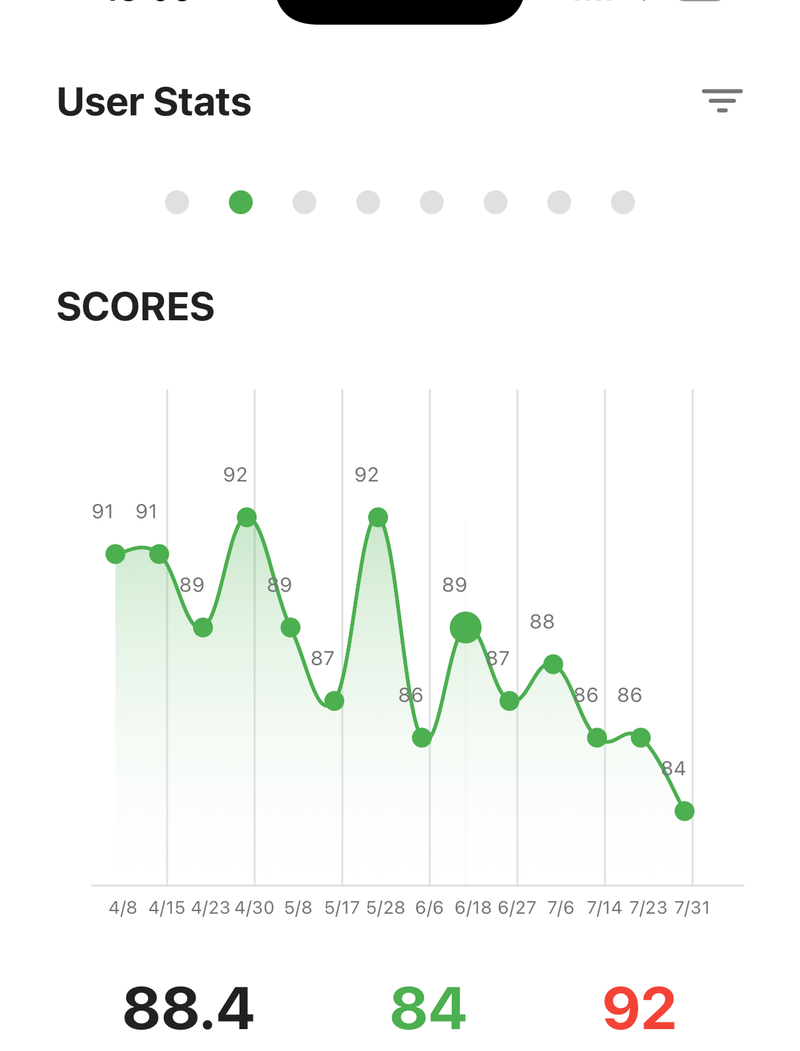
The Scores page plots every valid round as a line, oldest to newest, with the score printed above each point. Nine-hole rounds are doubled so they sit on the same scale as your 18s. Under the chart you get three numbers: average, best, and worst.
Tap any point on the line and a card appears with the course and date for that round. Tap the card and golfity opens the round itself. That path matters when you spot an outlier: instead of guessing why one dot sits ten shots above the rest, you are inside the scorecard in two taps.
Strokes gained, round by round
The Strokes Gained Last Rounds page is the one to check when your scores look flat but something feels different. It lays out your shot-by-shot rounds as a table, one row per round, with a column for each strokes gained category and a total.
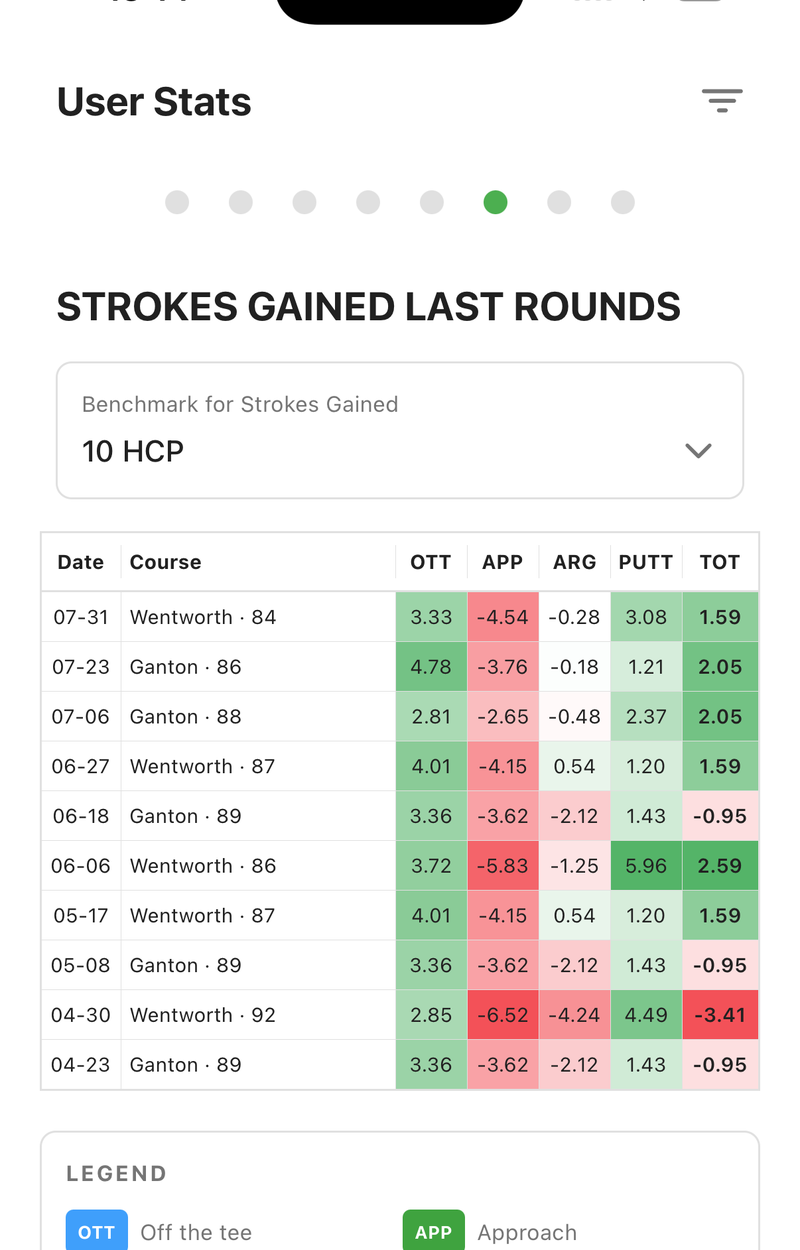
Cells are shaded on a scale from red to green against your own range, so a column of green under approach and a column of pink under putting reads at a glance. A benchmark selector at the top switches who you are measured against, from PGA Tour down through handicap levels. Most amateurs learn more from a handicap comparison, for the reasons in why comparing to a 10-handicap can be better than comparing to a pro.
Only rounds tracked shot by shot appear here. Total-score and hole-by-hole rounds still count toward your scoring history, they just have no shot data to break down.
The full list of rounds
For the plain chronological record, go to your profile and open Your rounds. Every round you have logged is listed newest first, with the date, course, and score, and each row opens the round. This is the fastest way to find a specific day rather than a trend.
Checked once a week, your golf stats history is mostly noise. Checked once a month against a filter, it becomes a report card. The monthly golf performance review walks through a routine that takes about fifteen minutes and gives you something to practice.